Do you know how… to read a benchmarking map?
Benchmarking is a form of analysis comparing a company, brand, service, product, or process with its competitors or data from different periods. This one of the most commonly used management methods is also used successfully in marketing and PR. This advanced comparative analysis method is used to measure the effects of communication actions in media reports.
The so-called benchmarking map may illustrate the real media position of an entity taking into account as any as 3 indicators. These may include for example the number of publications, favourability of information, impressions, or AVE. It can be used to compare not only companies, but also specific projects and development of products or services over time.
A cyclical comparative analysis is a great tool for evaluating strategy implementation, comparing the performance of a company with its competitors, or analysing process effectiveness.
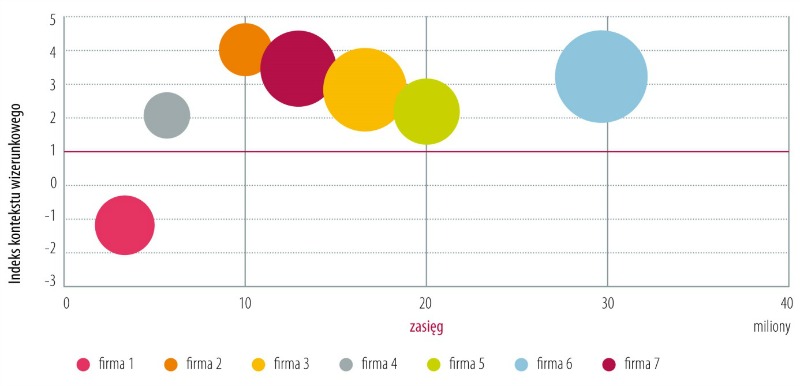
Let’s have a look at the map showing PR effectiveness of seven companies. It includes: image context index (favourability), impressions of the information on the company (number of potential contacts of recipients with the publications) and the number of information reflected by the size of the ball.
The location of the ball on the chart is a resultant of all the elements mentioned above. Right top corner means the strongest position. It is taken by company 7, which collected a high number of information with positive favourability. Company 1 had many negative information, yet its impressions index was low (left bottom corner). Its position would be even weaker if these unfavourable publications had high impressions. It would mean that such coverage reached many recipients (right bottom corner).
DOWNLOADS

REACH CUSTOMERS,
BOOST SALES